Recent events have clearly illustrated the important role that companies within the biotechnology sector have in modern society. Given the volatile nature of biotech, many active traders look to the charts of popular exchange-traded products and their top holdings for clues as to the future direction of the segment. In this article, we’ll take a look at several charts from across the biotech space and try to determine how traders will be positioning themselves over the weeks and months ahead.
SPDR S&P Biotech ETF (XBI)
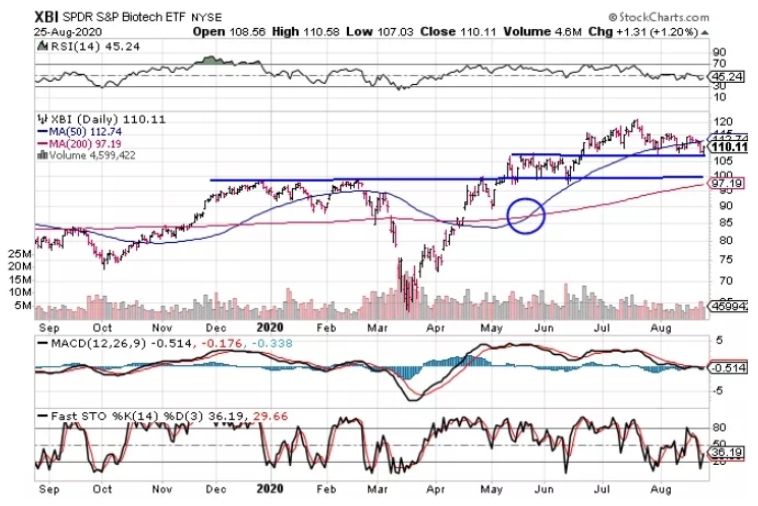
As mentioned above, many active traders turn to niche exchange-traded products for clues about the future direction of segments such as biotech. As you can see from the chart of the SPDR S&P Biotech ETF (XBI) shown below, the bulls are in clear control of the momentum.
Recent price action has also resulted in a bullish crossover between the 50-day and 200-day moving averages, which will most likely be used to mark the beginning of a dominant long-term uptrend. Depending on risk tolerance, traders will most likely look to place buy orders near one of the illustrated trendlines and protect against a selloff by placing stop-loss orders below $97.19.

Novavax, Inc. (NVAX)
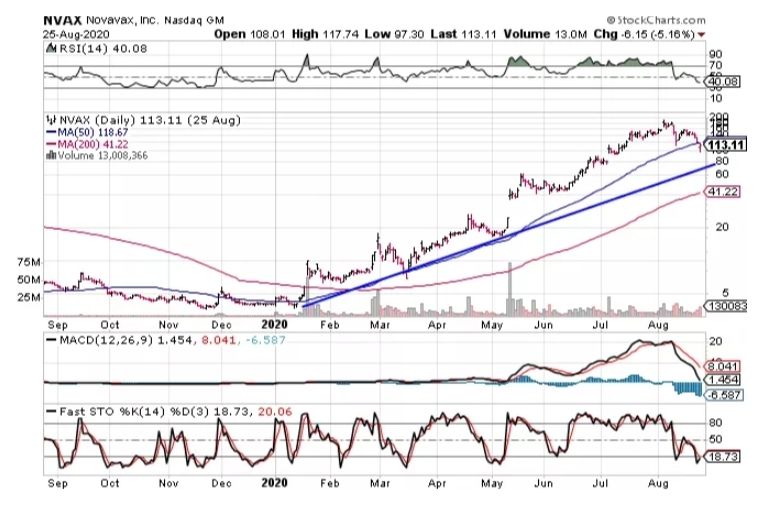
As the hunt for a COVID-19 vaccine continues, one of the companies of specific interest to traders is Novavax, Inc. (NVAX). Taking a look at the chart below, you can see that the stock price has rocketed higher so far in 2020, and the bullish momentum shows little signs of reversing any time soon.
Many followers of technical analysis will likely be watching to see if the recent pullback will continue to send the stock’s price down toward the support of the ascending trendline. At that level, the risk/reward setup would be more palatable than at current levels just below the 50-day moving average.

Invitae Corporation (NVTA)
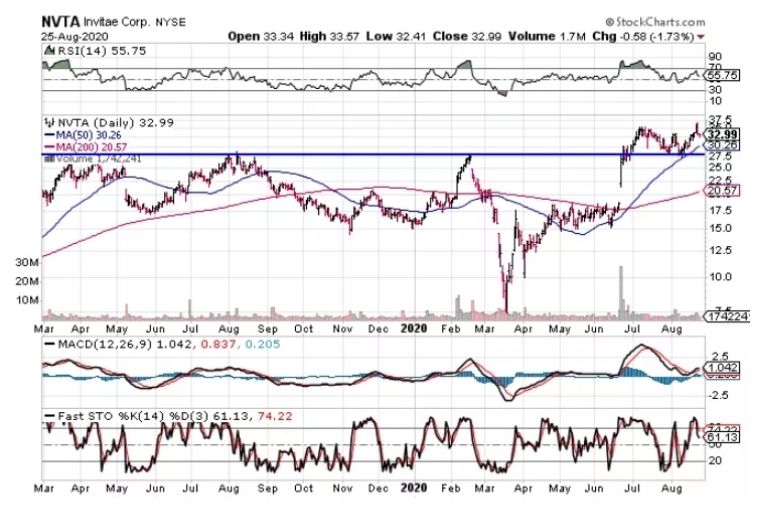
Another chart that will be of specific interest to active traders is Invitae Corporation (NVTA). As one of the top holdings of the IBB ETF, Invitae will likely be used as a leading indicator for how other mid-cap biotech stocks may perform over the weeks ahead. Taking a look at the chart below, you can see that the price recently rose above the key resistance of a horizontal trendline near $27.50.
The breakout and bounce from the 50-day moving average after a brief pullback are clear technical signs that the bulls are in control of the momentum. From a risk-management perspective, traders will look to buy as close to current levels as possible. To protect against a change in sentiment or fundamentals, most traders will likely look place stop-loss orders below the trendline or the 200-day moving average, depending on risk tolerance and investment horizon.

The Bottom Line
The important role of biotech companies in society and investment portfolios has become clear in recent months. Active traders who follow the charts will likely be adding more biotech companies to their portfolios over the months ahead. Based on the proximity to major support levels, it is clear that the risk/reward will remain in the favor of the bulls until prices close below the support levels or technical indicators suggest otherwise.
The original article can be found here: https://www.investopedia.com/3-charts-suggest-biotech-stocks-are-headed-higher-5075788


